 After you complete the installation and configuration, Google SecOps begins receiving BloodHound Enterprise Attack Path data through the connector. This page explains how that data is organized and how analysts can work with it during an investigation.
Understand the investigation structure
The integration organizes BloodHound Enterprise findings into Google SecOps cases, alerts, and events.Review cases, alerts, and events
Use the following workflow to inspect the findings created by the connector.1
Open the Cases page
With alert grouping configured, a case is created for each unique domain. The case contains alerts for each distinct BloodHound Enterprise finding or path title, and the events under those alerts capture the details of each Attack Path occurrence.
- Open your Google SecOps dashboard.
- Select Cases from the navigation menu.
- Review the list of cases created by the BloodHound Enterprise connector.
2
Inspect alerts in a case
Each alert corresponds to a distinct BloodHound Enterprise finding or path title.
- Open a case for the domain that you want to investigate.
-
Review the alerts in that case.

3
Inspect events in an alert
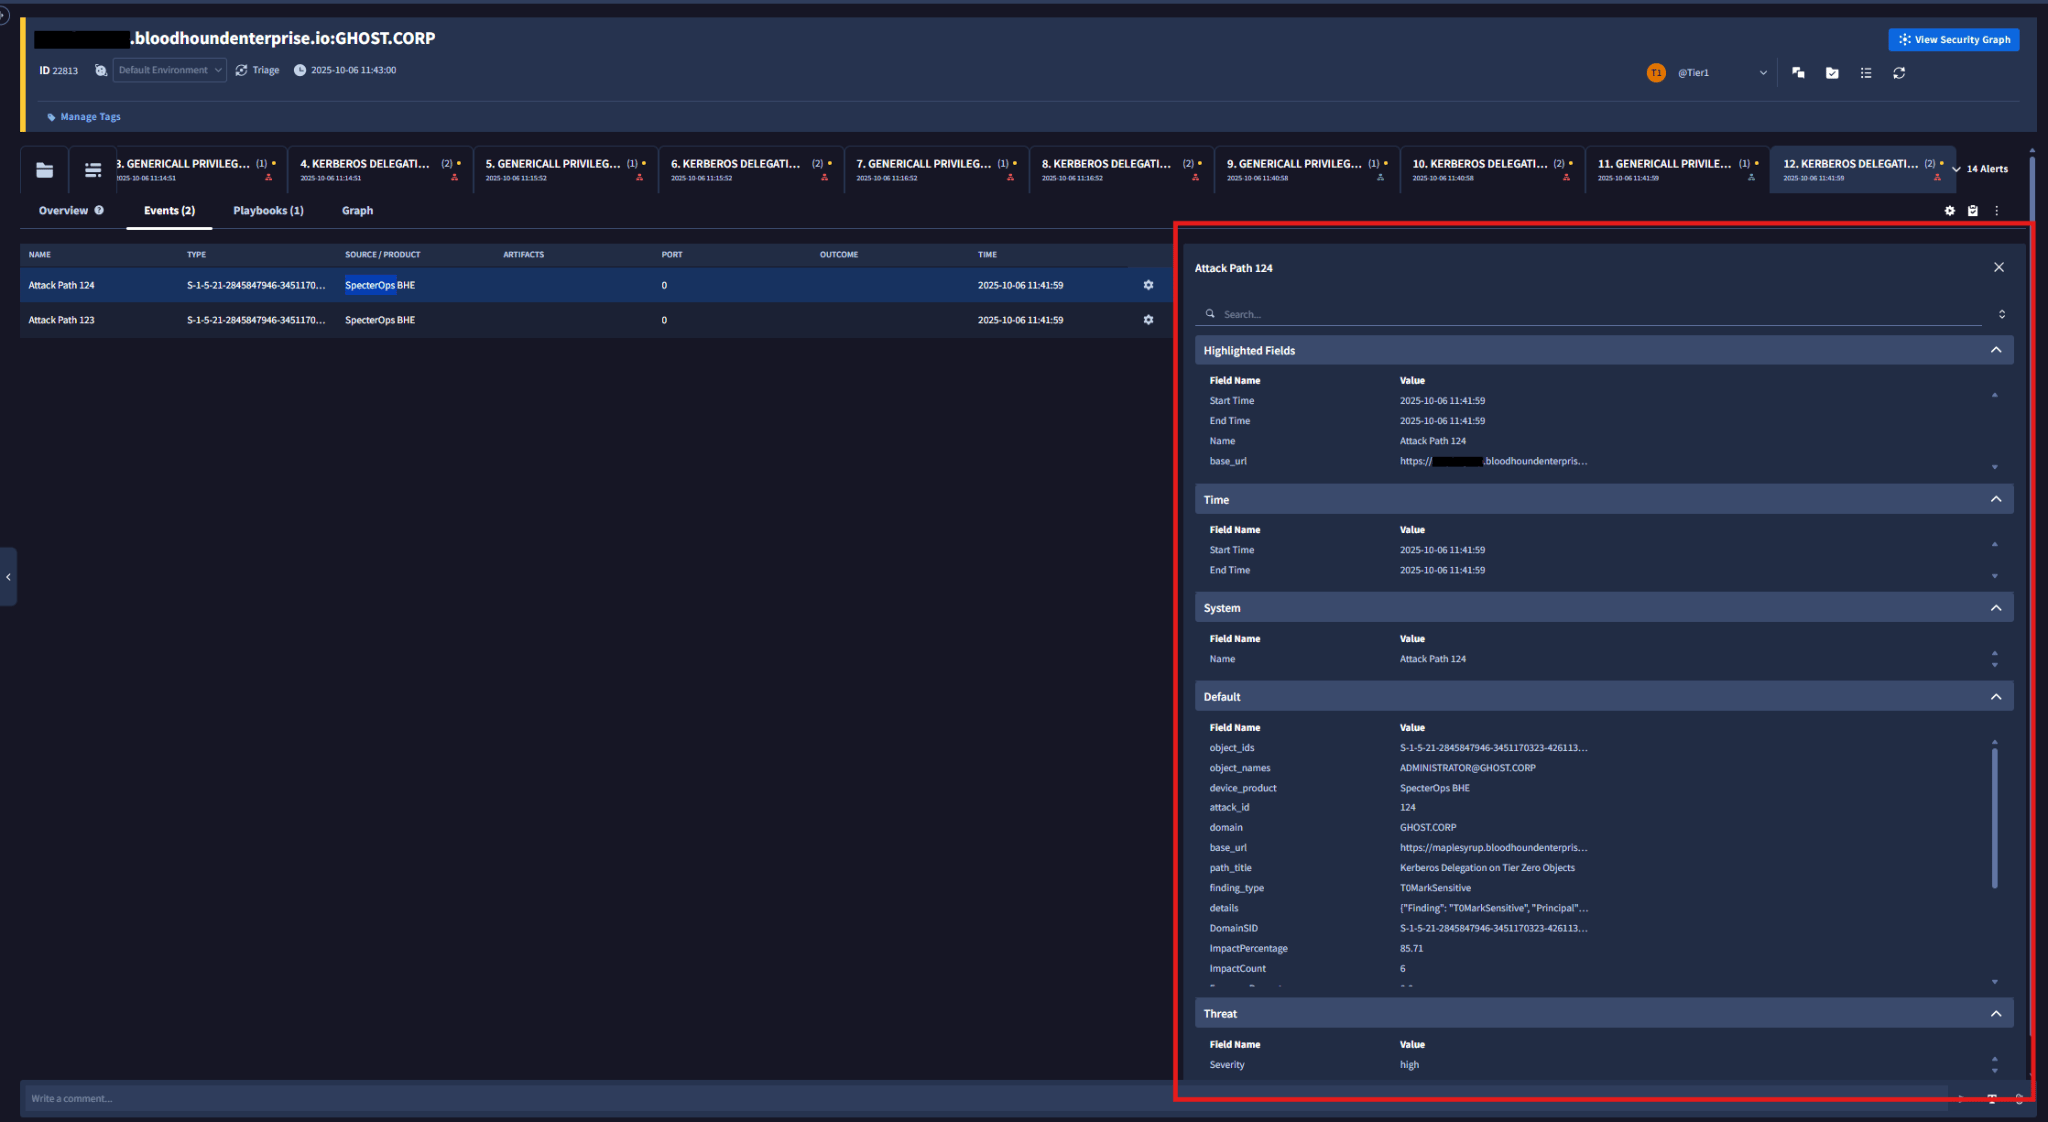
Event details include the step-by-step path traversal and identifiers such as
object_id.- Open an alert in the case.
-
Review the events listed under that alert.
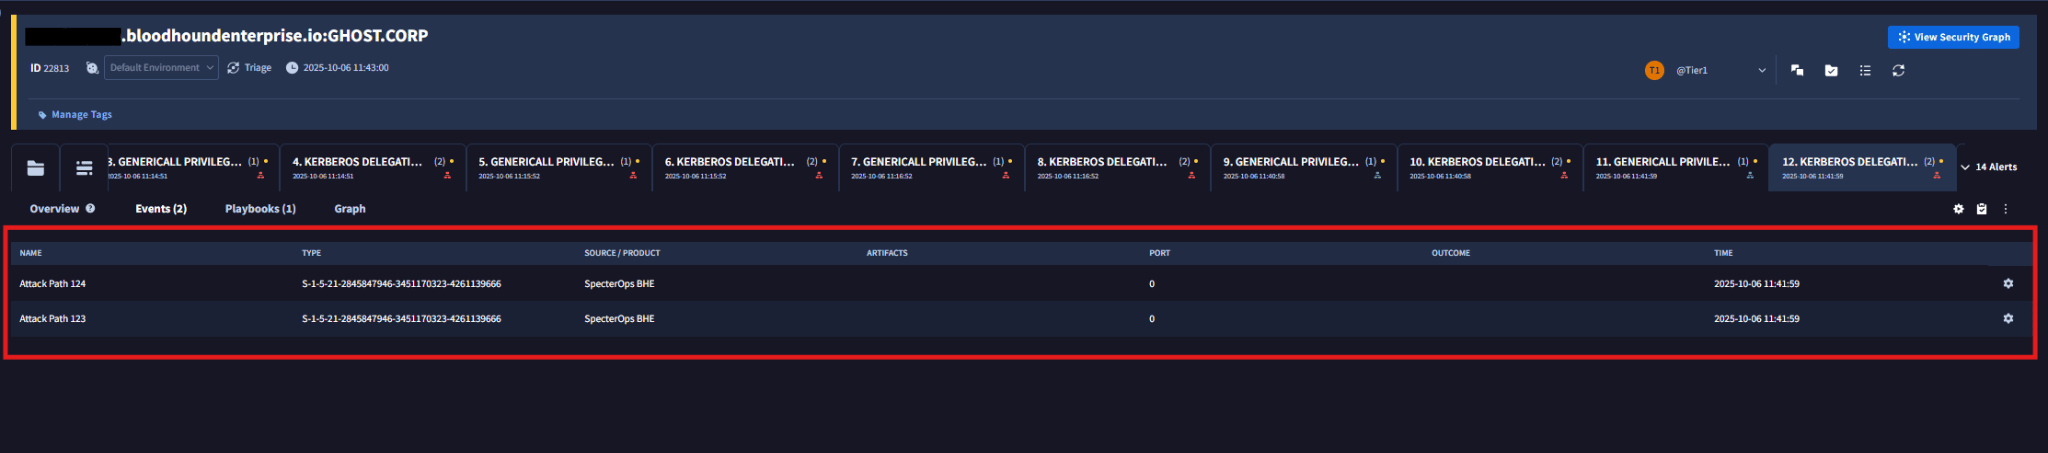
-
Double-click an event to open the full Attack Path details.
Work with playbooks
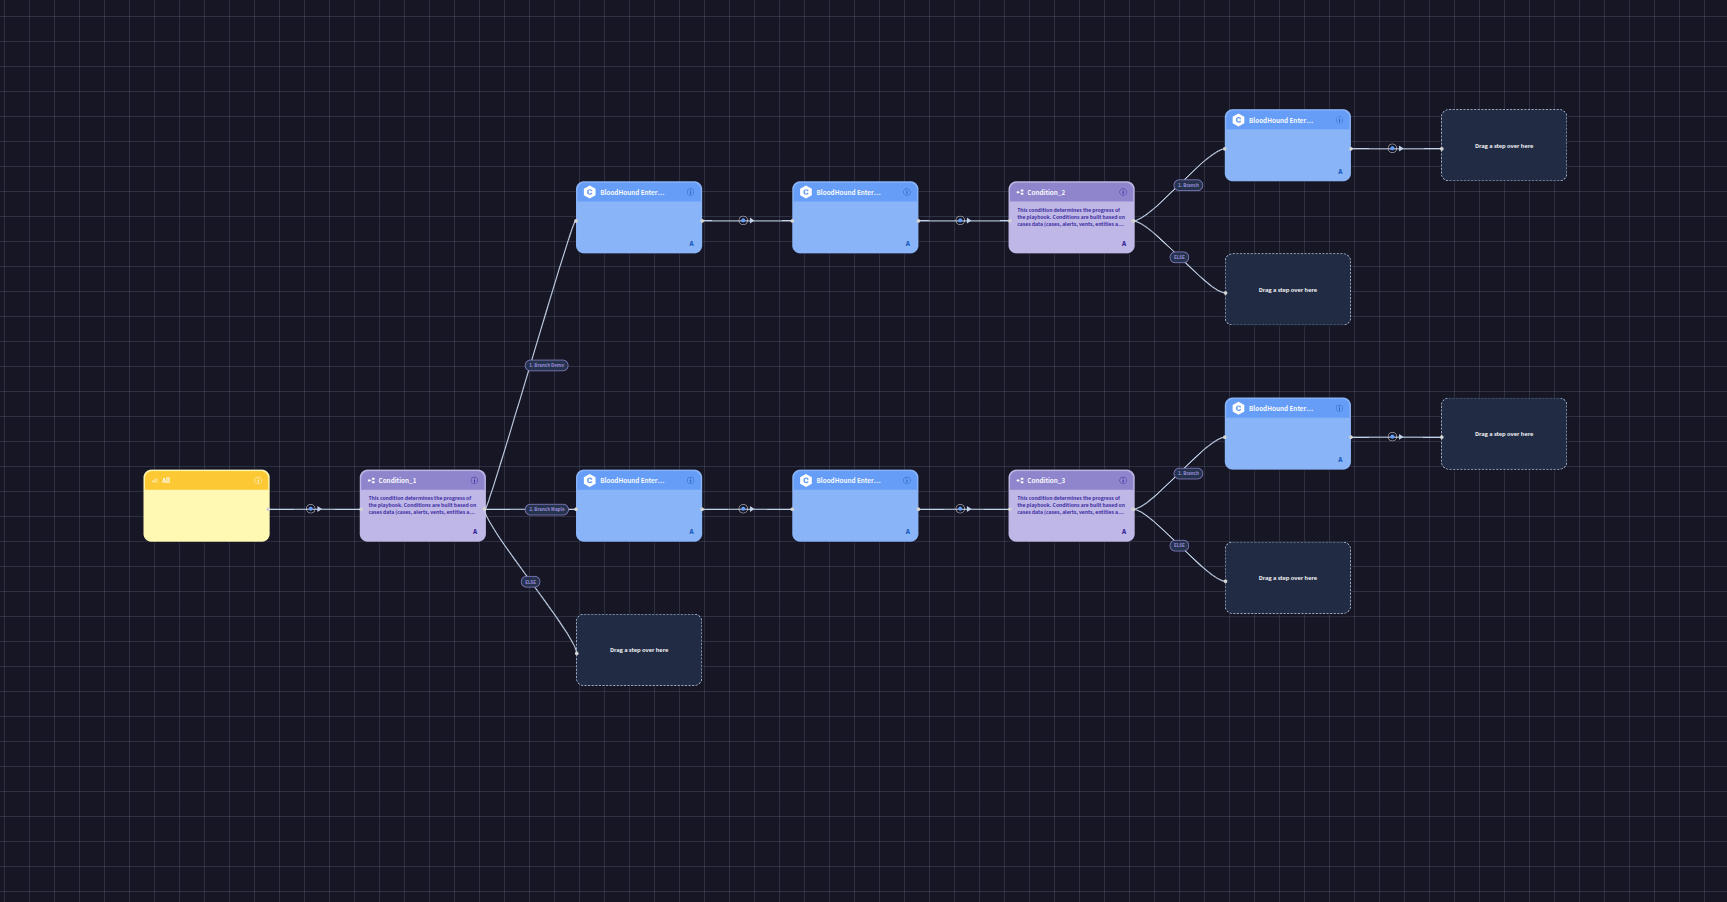
The BloodHound Attack Path Alerts Playbook can run against generated cases. You can also create your own playbook if you want to extend the workflow in Google SecOps.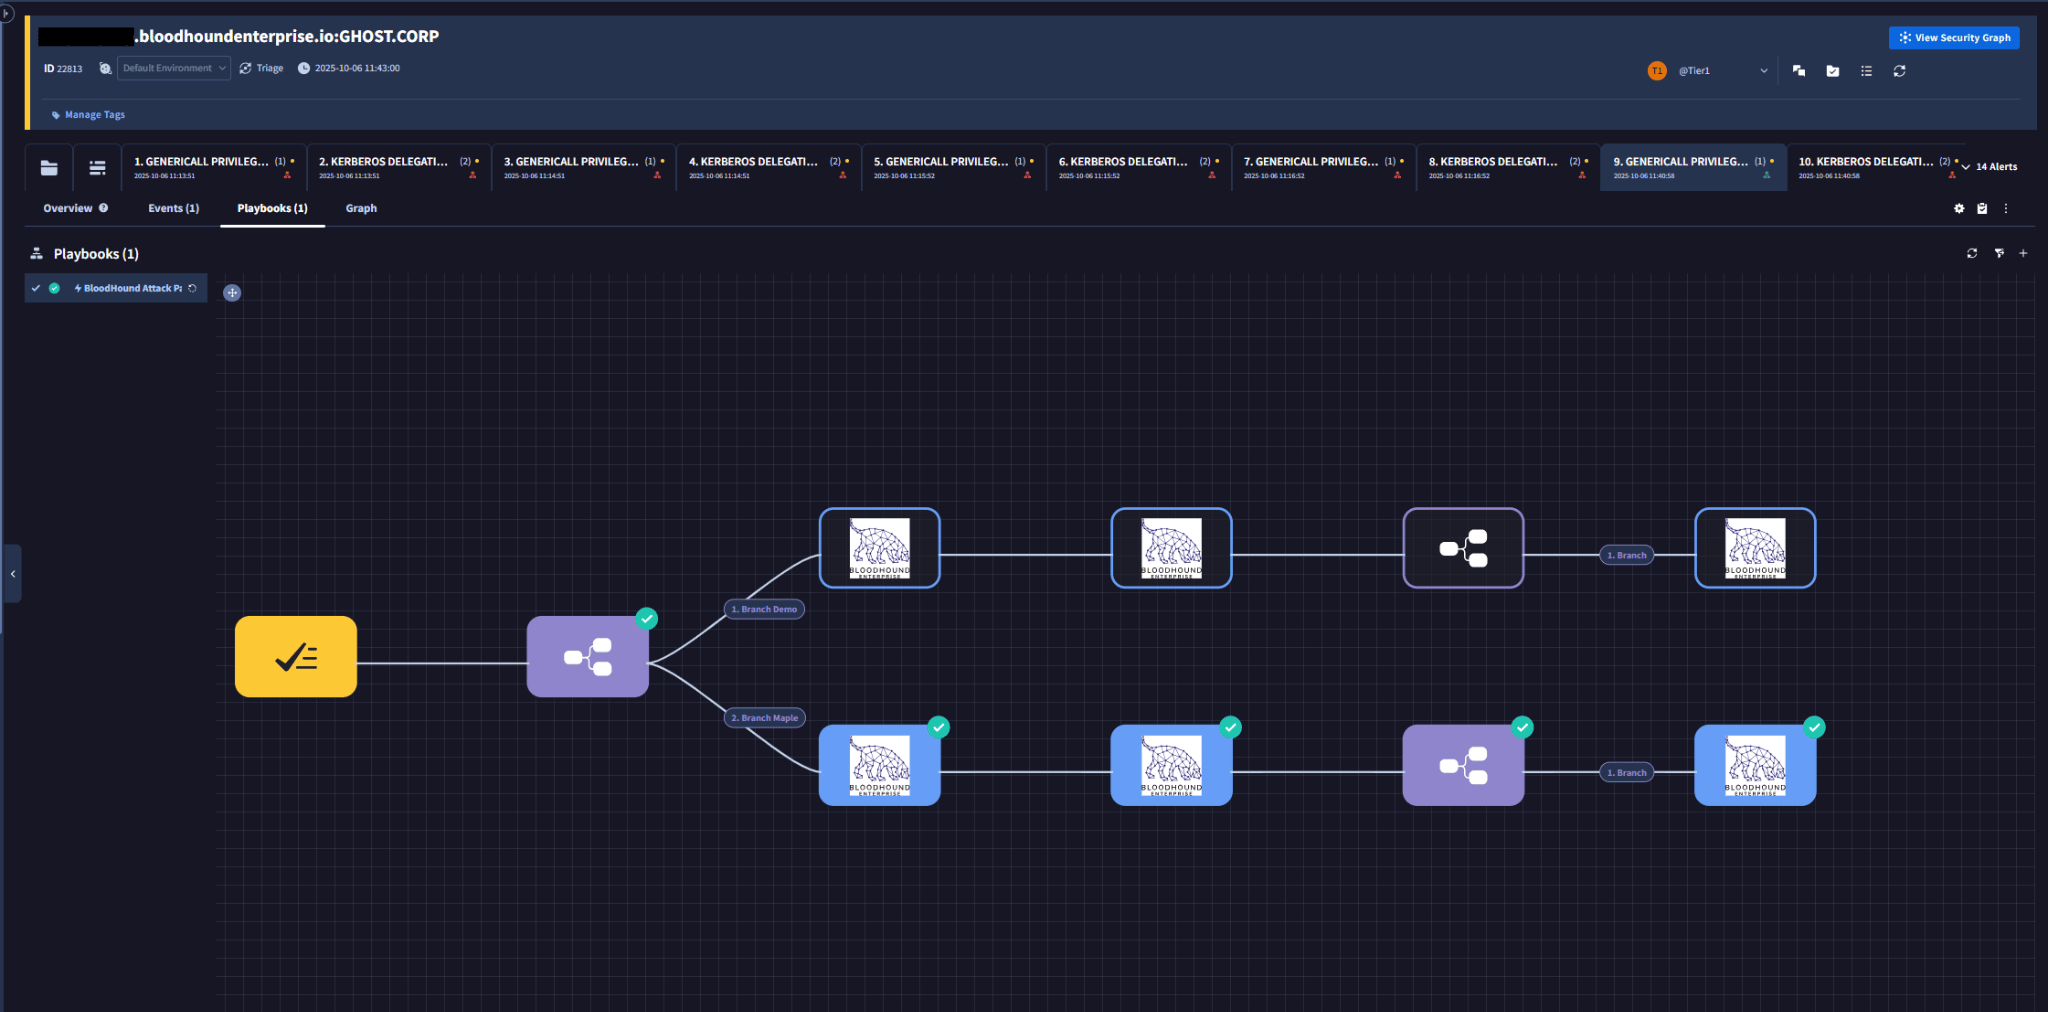
1
Create a custom playbook
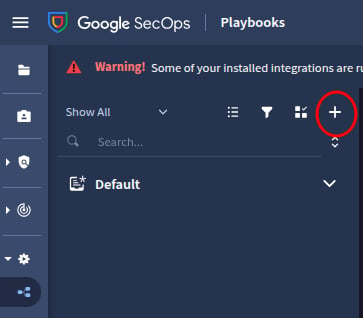
- Go to Response > Playbooks.
-
Click the add (+) icon.
-
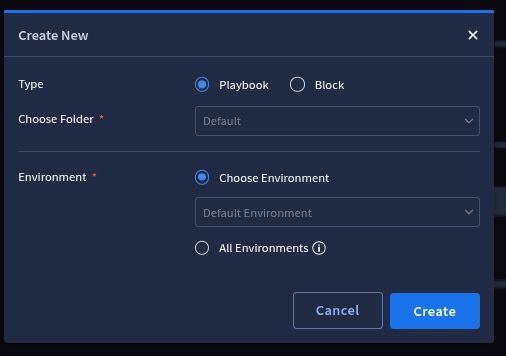
Select Playbook as the type and click Create.
-
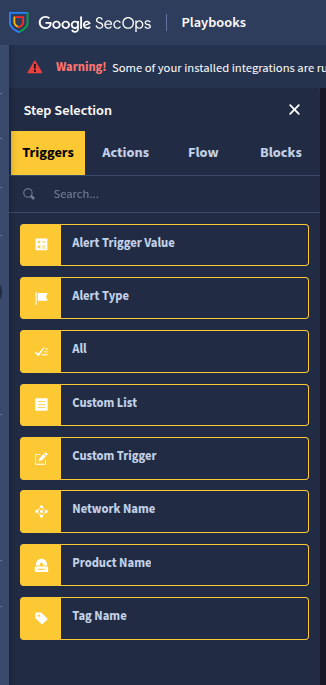
Build the custom playbook by adding components from Actions, Triggers, Blocks, and Flows.
2
Review playbook results
After Google SecOps creates the cases, one playbook runs for each case.The following example shows the consolidated playbook results for one case.